Note
Go to the end to download the full example code.
Quickstart: from a raw recording to clean epochs#
This tutorial takes one EEG recording through the whole of meeg-utils: check how well it was recorded, clean it with a recommended pipeline, look at what every step did, cut it into epochs and save the result.
We use the EEG of MNE’s sample recording (60 channels, an auditory and
visual oddball-like task, 277 s). The first run downloads the dataset
(1.6 GB) into ~/mne_data.
import matplotlib.pyplot as plt
import mne

import meeg_utils as meu

mne.set_log_level("ERROR")

data_path = mne.datasets.sample.data_path()
raw = mne.io.read_raw_fif(data_path / "MEG" / "sample" / "sample_audvis_raw.fif")
raw.pick(["eeg", "eog", "stim"]).load_data()
raw.info["line_freq"] = 60.0  # recorded in the US; BIDS data carry it in the sidecar
raw
meeg-utils never guesses facts about a recording: the power-line frequency
above is read from BIDS sidecars when there are any, and an error asks for
it when there are none. meeg_utils.io.read() reads any file MNE reads,
with its BIDS sidecars.
1. Check the recording#
meeg_utils.qc.inspect() runs every acquisition check that applies to
the recording and gives each finding a level: fail and warn are
problems, ok passed, and info is a measurement reported without a
verdict (its normal range depends on the participants and the setup).
report = meu.qc.inspect(raw)
print(report)
<QCReport /home/runner/mne_data/MNE-sample-data/MEG/sample/sample_audvis_raw.fif level='warn'>
  ok   amplitude
  ok   bridging
  warn outlier_channels
         - outlying EEG channels (LOF > 1.5): 1 (> 0); EEG 007
  warn narrowband_noise
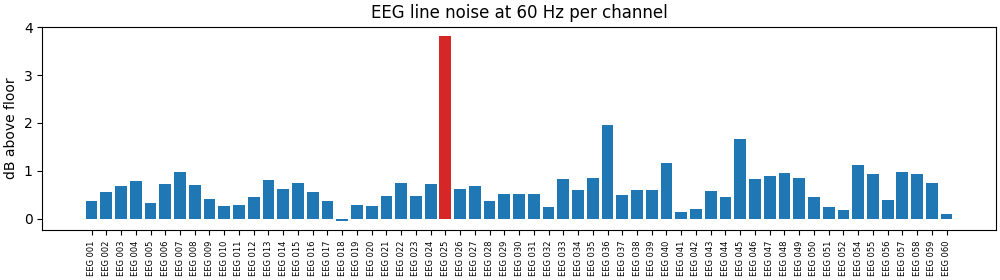
         - EEG channels with unusually strong line noise: 1 (> 0); check their contact: EEG 025
  info muscle
  info blinks
  ok   digitization
  ok   events
  skip impedance: found no impedances in the recording (pass impedances=...)
  skip heart_rate: needs an ECG channel (or MEG magnetometers)
  skip squid_jumps: needs MEG channels
  skip head_movement: needs MEG channels
  skip chpi_snr: needs MEG channels
  skip empty_room: needs MEG channels
  skip bids_metadata: the recording is not in a BIDS dataset
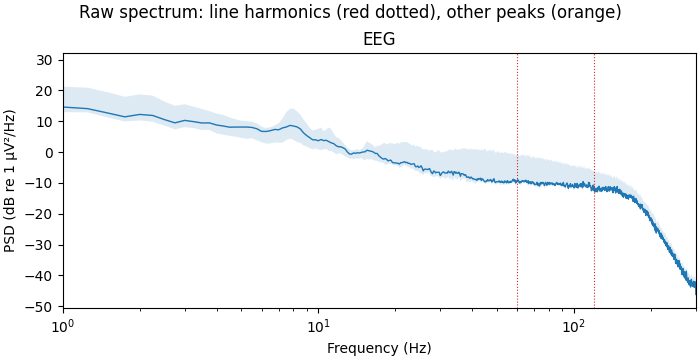
Every check can draw what it measured. The spectrum shows the 60 Hz line noise and its harmonics, and how strong the line noise is per channel:
figs = report.checks["narrowband_noise"].plot()
2. Clean it#
A preset is an ordinary Pipeline. eeg-erp is the
recommended EEG pipeline; each step’s parameters come from the literature
or from MNE-BIDS-Pipeline, with the sources listed in the presets guide.
pipe = meu.Pipeline.preset("eeg-erp")
pipe
fit_transform learns what each step needs from this recording (bad
channels, the ICA decomposition, …) and applies it. The input is not
modified.
clean = pipe.fit_transform(raw)
3. See what every step did#
Every fitted step has qc_ metrics, collected in pipe.qc_:
pipe.qc_["bads"]["eeg"]["bads"], pipe.qc_["ica"]["excluded"]
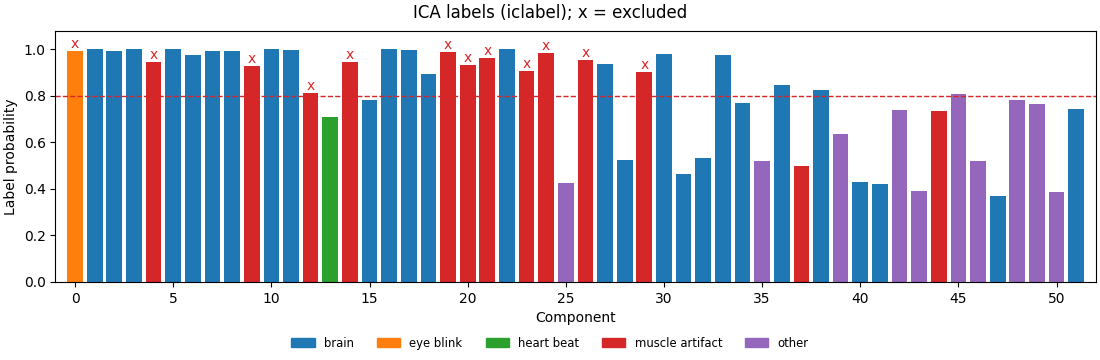
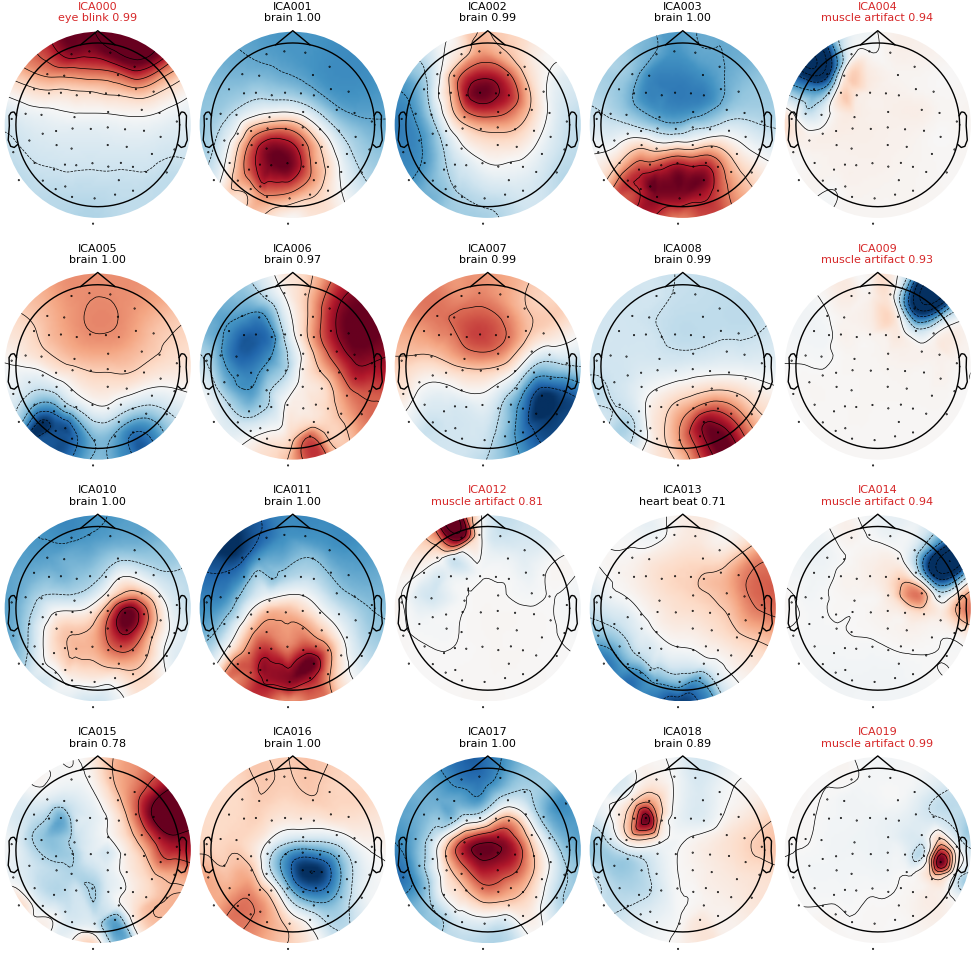
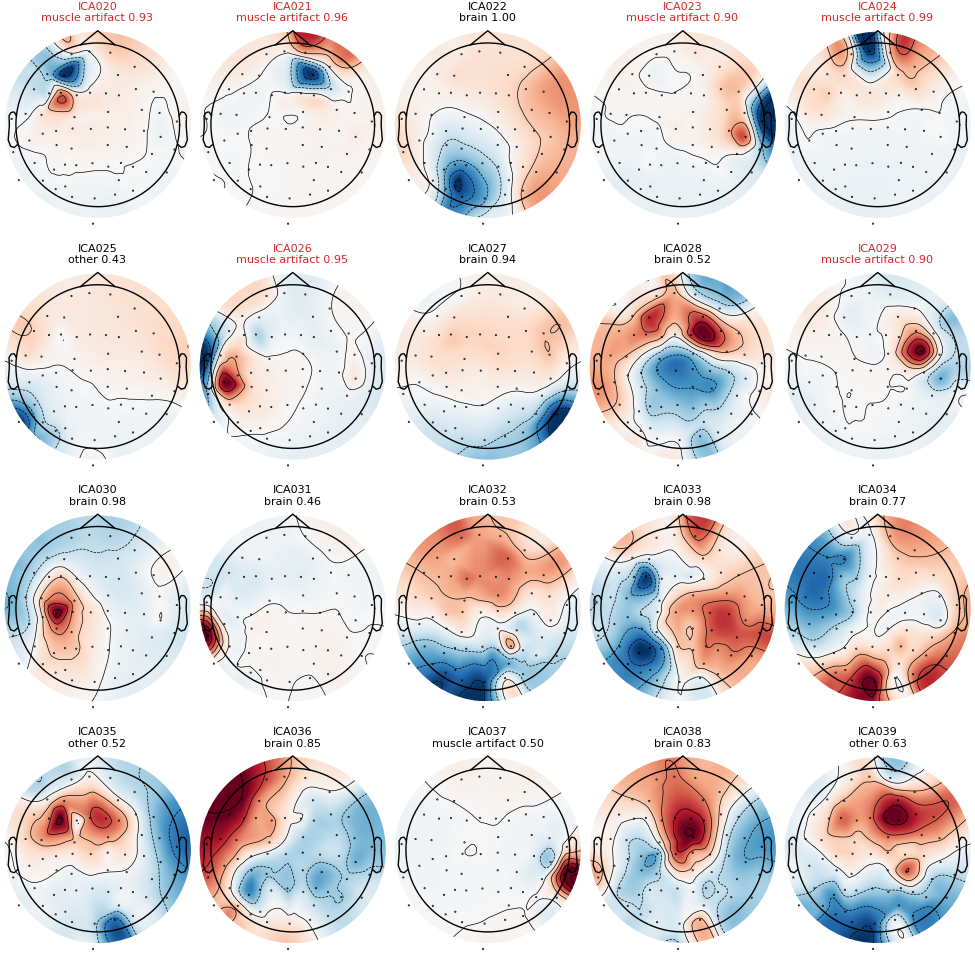
(['EEG 008', 'EEG 009', 'EEG 015', 'EEG 018', 'EEG 019', 'EEG 023'], [0, 4, 9, 12, 14, 19, 20, 21, 23, 24, 26, 29])
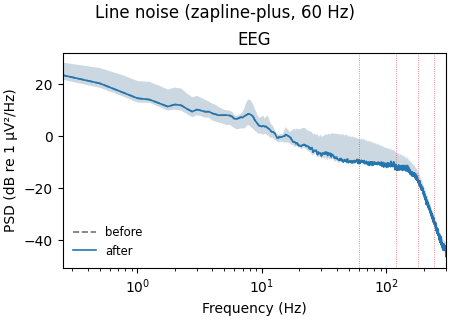
and can draw figures. ZapLine-plus removed the line noise without notching the spectrum:
pipe["line_noise"].plot("psd")["psd"]
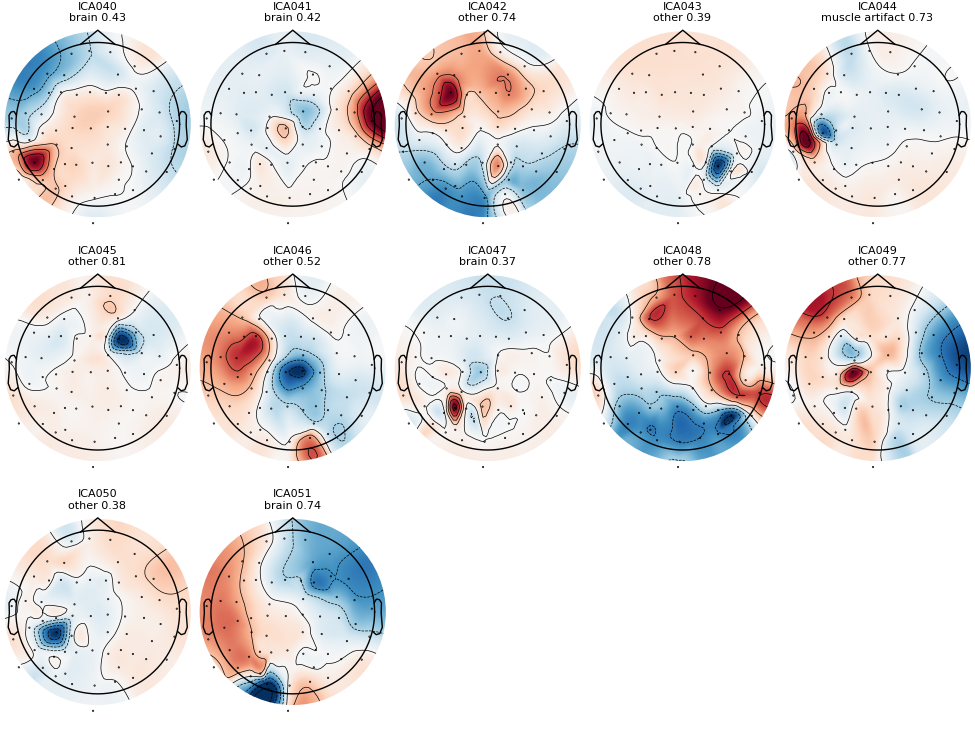
ICLabel classified the independent components; those labelled as artifacts with a probability of at least 0.8 were removed:
pipe["ica"].plot("labels")["labels"]
figs = pipe["ica"].plot("components")
4. Epochs#
Epoching is a second stage, applied to each preprocessed run. The sample recording marks its stimuli on a stimulus channel:
event_id = {"auditory/left": 1, "auditory/right": 2, "visual/left": 3, "visual/right": 4}
ep = meu.Pipeline.preset("eeg-erp", stage="epochs", event_id=event_id)
epochs = ep.fit_transform(clean)
epochs
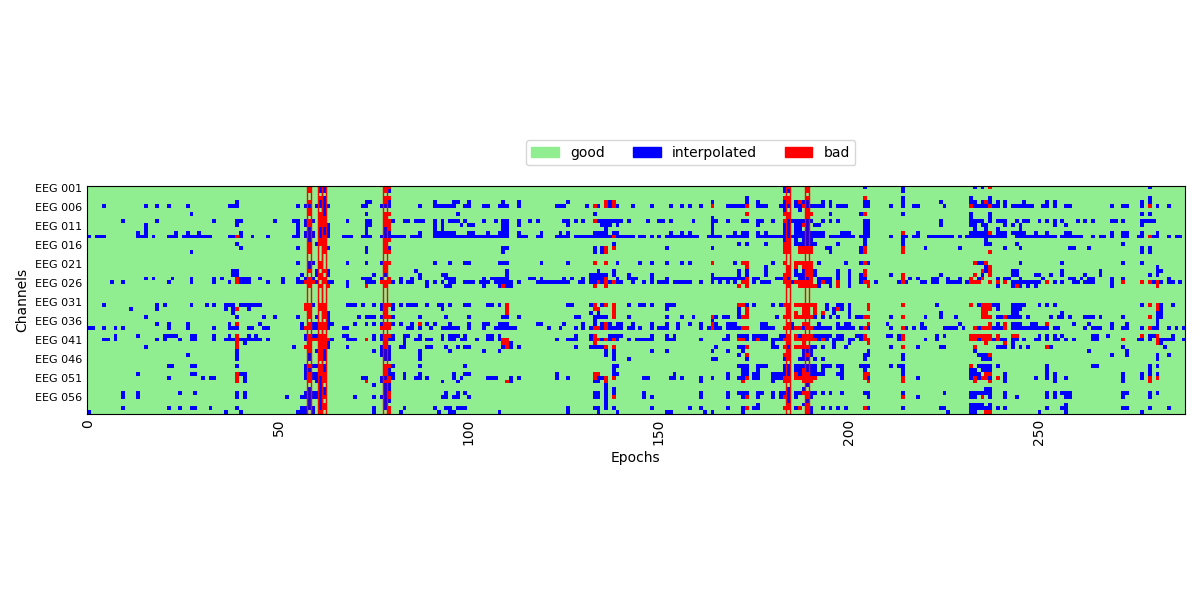
autoreject repaired or dropped the epochs with artifacts left:
ep["autoreject"].plot("reject_log")["reject_log"]
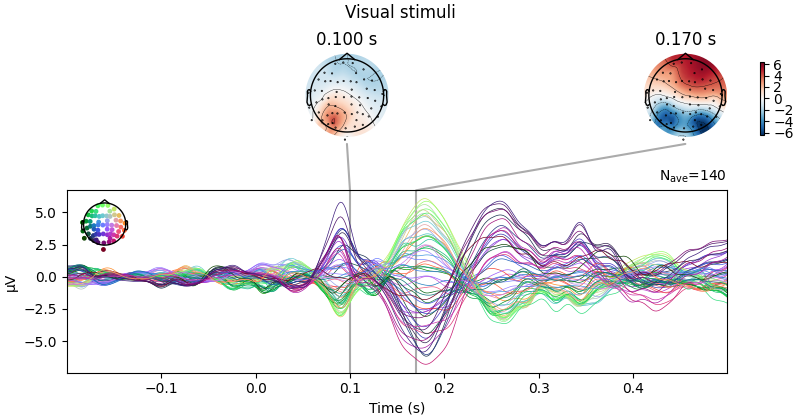
evoked = epochs["visual"].average()
evoked.plot_joint(times=[0.1, 0.17], title="Visual stimuli")
plt.show()
5. Save#
meeg_utils.io.save_derivative() writes the data in BIDS derivative
layout with a JSON sidecar holding the pipeline configuration, software
versions and every QC metric:
meu.io.save_derivative(clean, source, "bids/derivatives/meu", pipeline=pipe)
For a whole BIDS dataset, meeg_utils.process_dataset() or the meu
command does all of the above run by run (see Whole BIDS datasets).
Total running time of the script: (3 minutes 41.344 seconds)